

Key Takeaways: Patient Engagement Statistics 2026
-
1Digital engagement is now a direct revenue lever, not just a care quality measure:
The one-to-one correlation between digital engagement scores and patient payment rates is the single most important data point in this report for practice managers. It means investing in portal access, digital scheduling, and automated messaging is measurable in collected revenue, not just satisfaction surveys. -
2Text-based outreach from recognizable numbers dramatically outperforms anonymous messaging:
89% of patients engage more with messages from familiar 10-digit numbers. 66% are more likely to attend appointments. 58% are more likely to complete care instructions. 41% are more likely to pay bills. These numbers make a compelling case for investing in a branded, consistent SMS communication identity rather than generic short-code messaging. -
3Patient portals have crossed from optional to expected:
Over three quarters of US patients were offered portal access in 2024. 95% of hospitals now allow patients to view clinical notes online. 92% offer secure provider messaging. Clinics that still treat portals as advanced features are already behind the standard that patients experience at hospital systems and expect everywhere else. -
4Chronic disease patients are your most engaged digital users and your highest-value recall segment:
61% of patients with at least one chronic condition activated their patient portal. RPM engagement rates exceed 78% in complex care programmes. These patients are already digitally motivated. Clinics that build engagement workflows specifically for chronic disease management capture the highest return on digital investment. -
5Rising portal message volumes are a workflow crisis hiding behind a positive engagement metric:
70% of medical groups reported increased portal message volume. Without structured triaging, templated responses, and clear asynchronous communication protocols, higher engagement produces higher staff burden rather than better outcomes. Engagement strategy must include operational planning for message volume management. -
6The engagement maturity gap is the real opportunity:
Fewer than half of hospitals had all advanced engagement capabilities fully implemented by 2024. For outpatient practices and group clinics, the gap is even wider. This is not a problem to worry about. It is a competitive opportunity. Practices that close their engagement maturity gap now will differentiate meaningfully from peers who are still reactive.
Patient engagement, the active involvement of patients in their own healthcare decisions and experiences, is rapidly becoming central to how clinics, group practices, and health systems drive better outcomes and financial success.
As digital tools, remote care, and data-driven strategies continue to expand in clinical use, 2026 represents a pivotal year in patient engagement trends: providers are now measuring engagement not as a soft concept but as a core performance indicator tied to revenue, adherence, and care quality.
In this blog, we’ll walk through the most important patient engagement data insights and metrics you need to know to shape strategy in the year ahead.
From how patients prefer to be contacted to how digital engagement improves financial performance, these patient engagement statistics and research findings offer a clear roadmap of what’s working, and what’s still a gap, in healthcare.
Table of Contents
10 Must-Know Patient Engagement Statistics in Healthcare for 2026
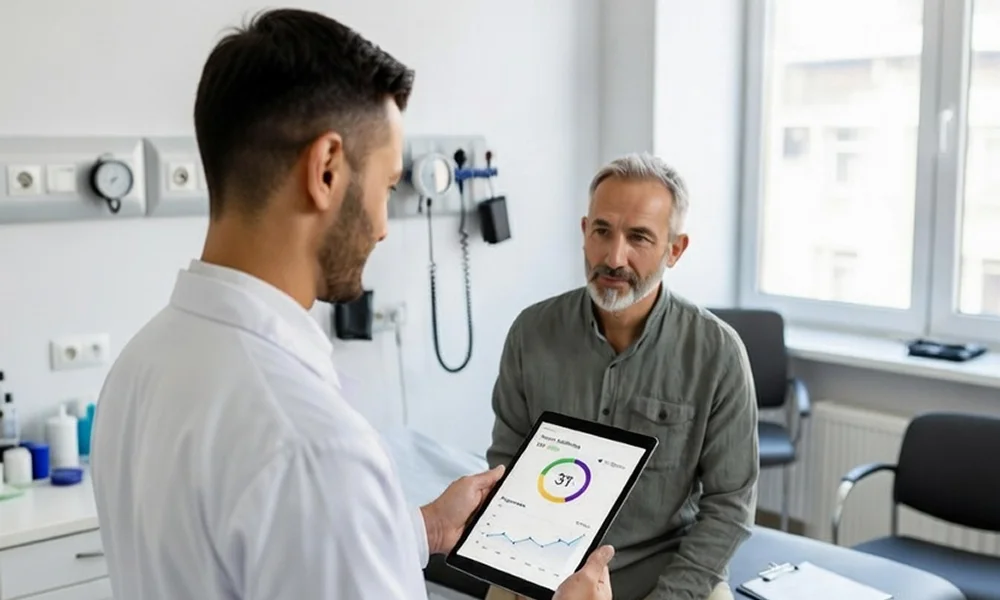
These are the 10 most critical, up-to-date patient engagement numbers in healthcare that should guide strategy and priorities for clinics, group practices, and healthcare networks this year.
1. Digital Engagement Directly Improves Collections
One leading measure of patient engagement metrics shows that for every one-point increase in digital engagement, there is a corresponding one-point increase in the share of total patient charges paid within a year.
This means practices scoring higher on digital engagement (like portal use, online scheduling, and digital payments) tend to collect more patient-responsibility revenue.
What it means: More robust digital engagement leads to improved patient responsibility payment performance, a powerful patient engagement study finding that ties engagement tools directly to revenue improvement.
2. Patients Prefer Recognizable, Text-Based Outreach and It Drives Key Outcomes
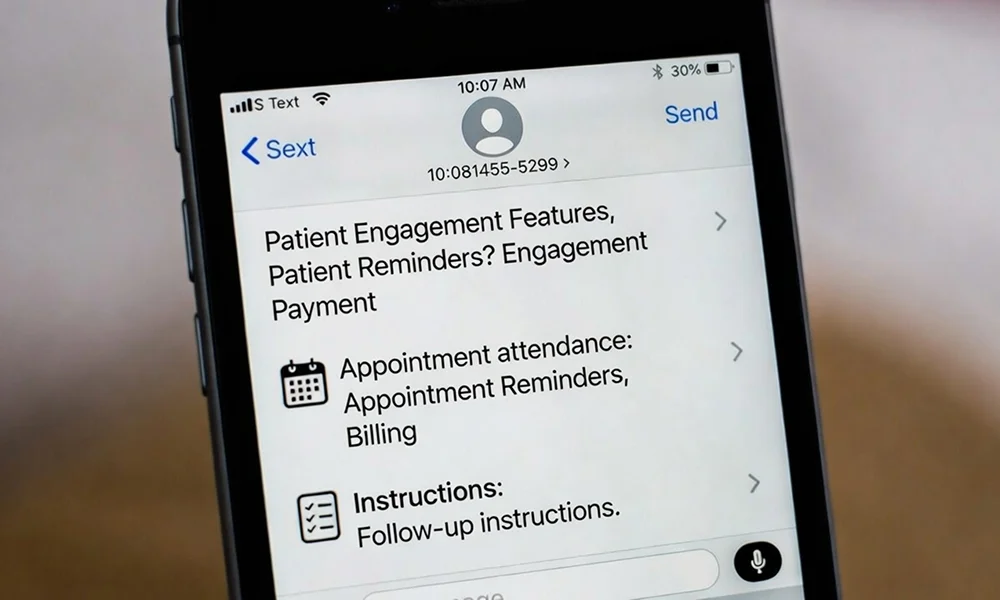
Communication matters. According to a recent patient engagement survey statistic, 89% of patients are more likely to engage with messages from a recognizable 10-digit phone number rather than anonymous or short-code SMS.
Beyond just engagement, these familiar numbers were tied to higher patient actions: 66% were more likely to attend appointments, 58% more likely to complete pre- or post-visit instructions, and 41% more likely to pay bills on time.
Operational implications: Text-based outreach that patients trust improves attendance, adherence, and revenue, highlighting the importance of patient engagement data insights into how patients prefer to interact.
3. The Patient Engagement Solutions Market Is Booming and Projected to Grow Significantly
The global patient engagement solutions market, technology designed to support engagement through portals, messaging, education, and remote care, is on a strong growth trajectory.
Forecasts suggest that from a base market size of roughly $27.7 billion in 2025, the segment will grow at around an 18.6% CAGR through 2035, driven largely by increasing demand for digital, telehealth, and patient-centric care tools.
Insight: This rapid growth in the patient engagement solutions market confirms that digital engagement technologies are not a fad. They are a long-term strategic investment and a key part of patient engagement trends in healthcare.
4. Patient Portal Access Is Now Mainstream and Growing
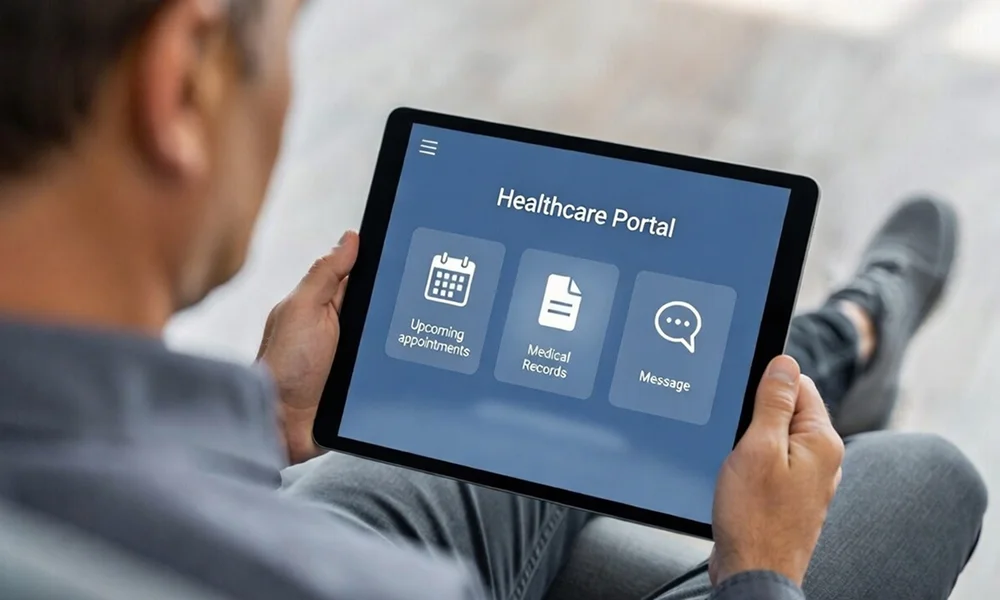
Patient portals, secure digital platforms where patients can view records, schedule appointments, and communicate with providers, have moved from “nice to have” to a baseline expectation.
In 2024, more than three-quarters of individuals in the U.S. were offered online access to their medical records via a portal or insurer, and portal use has risen steadily.
Among patients with chronic conditions, portal use is even more prevalent, often serving as the hub of digital patient engagement. This signals a shift in patient engagement trends: patients expect convenience, transparency, and access to their health information anytime, anywhere.
5. Hospitals Offer Robust Patient-Facing Capabilities Beyond Portals
Hospital systems, often early adopters of digital engagement technologies, continue to expand patient-facing capabilities. Recent data shows:
- 95% of hospitals let patients view clinical notes online
- 92% provide secure provider messaging
- 81% support access via mobile apps
- Around 70% use FHIR-based apps that allow interoperable access to health data
Benchmark for practices: These systems set expectations for outpatient clinics and group practices, showing that robust portal access, messaging, and app-based tools are rapidly becoming standard elements in patient engagement research.
6. IT-Enabled Engagement Is Growing but Not Fully Mature Across Settings
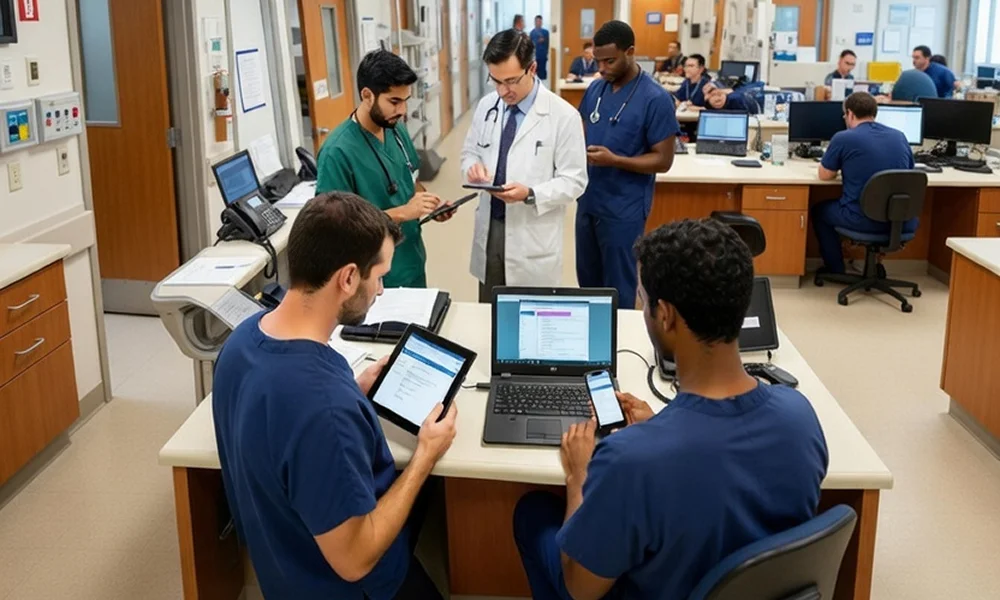
Across the healthcare ecosystem, the inpatient advanced engagement capabilities rose from 56% in 2021 to 69% in 2024; outpatient capabilities increased from 49% to 64%. Fewer than half of hospitals had all advanced capabilities fully implemented by 2024.
Insight: While growth in patient engagement technology is strong, many providers still have significant room for innovation. This highlights the potential for further advancements in leveraging digital tools to deepen patient involvement.
7. Portal Use Is Highest Among Patients With Complex Health Needs
Research into patient engagement rates statistics shows that patients with chronic conditions, such as diabetes, cardiovascular disease, and cancer, are more likely to activate and use patient portals than healthier individuals.
In a large observational study, 61% of adults with at least one chronic condition activated their patient portal, and 54% logged in at least once annually.
Patients with chronic conditions, such as diabetes, cardiovascular disease, and cancer, showed even higher usage. High utilizers, especially those with conditions requiring ongoing monitoring or management, made greater use of digital tools.
What this means: Digital engagement tools are especially useful for high-risk patients, a key patient engagement data insight that clinics can use to prioritize interventions and tailor educational efforts.
8. Portal Messaging Volumes Are Surging with Workflow Implications
As more patients access digital portals, message volumes are increasing rapidly. Recent surveys show that 70% of medical groups reported increased portal message volume, with only 1% seeing decreases.
In some cases, policy changes that tied portal threads to billable e-visits led to an 8.8% decrease in billable threads, underscoring how financial incentives affect engagement patterns.
Insight: Practices must plan staffing and workflow around asynchronous communication, part of evolving patient engagement trends that require operational attention.
9. RPM Engagement Often Exceeds 75% and Shows Positive Outcomes
Remote Patient Monitoring (RPM) is one of the most engaging digital modalities, especially for patients with chronic disease or complex care needs.
In some large RPM programs, engagement rates exceed 78%, and participants were linked to improvements in outcomes such as reduced emergency department visits and lower readmission rates.
Additionally, RPM adoption contributes to a growing market expected to reach tens of billions of dollars in coming years, further evidence that tech-enabled engagement is reshaping care delivery.
10. Wearables, Telemedicine, and Digital Health Tools Continuously Shape Engagement
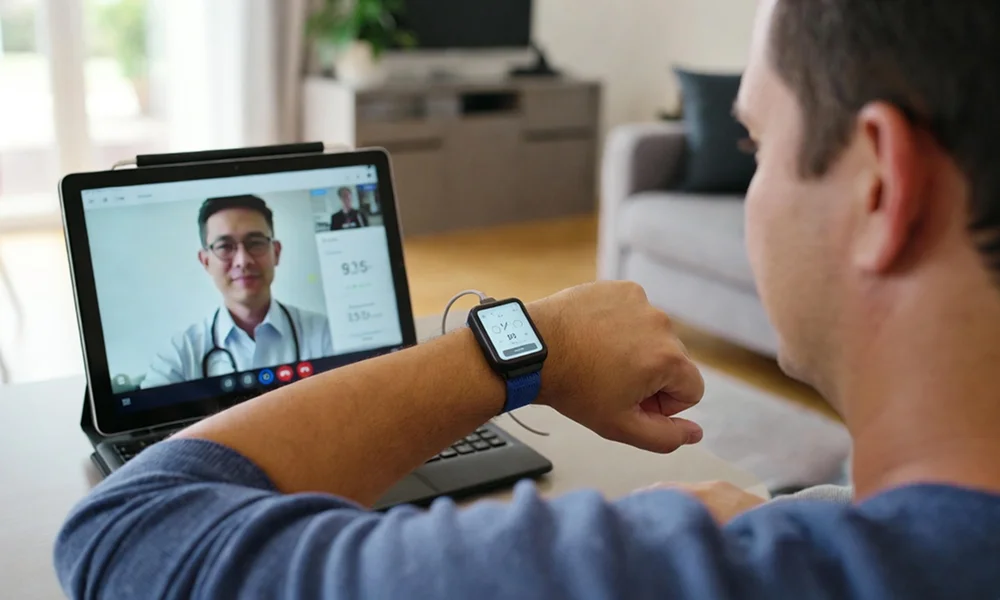
Digital tools beyond portals, including wearable devices and telemedicine, play a growing role in patient engagement. Wearable tech usage has been associated with engagement increases of around 20%, particularly among patients managing chronic conditions like diabetes and hypertension.
Meanwhile, telehealth is estimated to have contributed to a 15% reduction in non-urgent emergency department visits in recent years, an indicator of how digital care channels can redirect care and deepen engagement.
Insight: Integrating wearables and virtual care into engagement strategies expands the touchpoints where patients interact with providers and creates new metrics that matter in patient engagement research and strategy.
What These Patient Engagement Numbers Mean for Your Strategy
Taken together, these numbers offer several clear patient engagement data insights for clinics and practices in 2026:
- Digital touchpoints drive outcomes: From revenue collection to appointment adherence and communication quality, digital engagement tools have measurable clinical and financial impacts
- Patients increasingly expect digital access: Portals, secure messaging, and app access are not nice extras; they are expected parts of care delivery and key patient engagement metrics to track
- There is still a maturity gap: Adoption is growing, but many providers have incomplete engagement toolsets, creating opportunity for strategic investment and improvement
- Track the right metrics: Measure portal activation rates, SMS opt-ins, RPM adherence, digital payment completion, and secure messaging volumes — these metrics matter in 2026 and beyond
Conclusion
The latest patient engagement numbers in healthcare show that engagement is no longer an ambiguous concept: it is central to financial performance, clinical outcomes, and patient experience.
As digital tools mature and patient expectations rise, providers that prioritize engagement strategy and begin tracking actionable patient engagement metrics will be better positioned to enhance outcomes and differentiate care.
Start by auditing your existing engagement tools and data, determine which of the key stats above are most relevant to your patient population, and then design a simple 12-month engagement roadmap.
Focusing on a small set of high-impact engagement measures, such as portal utilization, text engagement rates, and RPM adherence, can unlock notable gains in both care quality and operational performance in 2026 and beyond.
Frequently Asked Questions
What patient engagement metrics should clinics track in 2026?
The highest priority metrics are portal activation rate, SMS and email opt-in rate, appointment adherence rate, RPM programme engagement rate, digital payment completion rate, secure portal message volume, and portal login frequency. These seven metrics give a complete picture of digital engagement depth across the patient population and identify where access improvements or outreach investment will deliver the greatest return.
How does digital patient engagement affect revenue collection?
Research shows a direct correlation: for every one-point increase in a practice’s digital engagement score, there is a corresponding one-point increase in the share of patient-responsibility charges collected within one year. Digital engagement through portal use, online scheduling, and digital payment tools is not just a care quality investment. It is a measurable revenue performance lever.
Which patients engage most with digital healthcare tools?
Patients with chronic conditions engage at significantly higher rates than healthier populations. In large observational studies, 61% of adults with at least one chronic condition activated their patient portal. RPM engagement rates exceed 78% in complex care programmes. Wearable technology adoption is also highest among patients managing chronic conditions such as diabetes and hypertension. Digital engagement investment delivers its greatest return when targeted at high-acuity patient populations.
What are the biggest patient engagement trends for small clinics in 2026?
Five trends matter most for small and independent clinics: patient portal access moving from optional to expected; SMS outreach from recognizable numbers significantly outperforming anonymous short-code messaging; rising portal message volumes requiring structured asynchronous communication workflows; RPM as a high-engagement tool for chronic disease panels; and the engagement maturity gap representing a competitive differentiation opportunity for clinics that close it faster than peers.
Where can clinics find reliable patient engagement data and benchmarks?
The most credible sources are HealthIT.gov and the Office of the National Coordinator for Health Information Technology for portal access data, the Agency for Healthcare Research and Quality for care access benchmarks, peer-reviewed journals including BMC Health Services Research and the Journal of Medical Internet Research for engagement outcomes research, and industry research from healthcare IT organisations such as athenahealth and KLAS Research for market trend data.
Want to Turn These Patient Engagement Statistics Into Real Results at Your Clinic?
Book a call to see how MedLaunch helps clinics close the engagement maturity gap with automated messaging, AI-powered scheduling, portal integration, and real-time engagement tracking so the statistics above become your metrics, not just benchmarks.