
Key Takeaways
-
1Experience drives outcomes: Experience shapes satisfaction, which influences engagement and clinical outcomes, so analytics should focus on actual care, not just survey scores.
-
2Unstructured feedback is valuable: Patient comments on platforms like Google and Yelp offer rich insights, and AI sentiment analysis can turn these into actionable experience indicators.
-
3Combining data reveals causes: Linking perception data with operational data (e.g., wait-time complaints) helps identify root causes and move from surface reporting to actionable insights.
-
4Analytics should guide coaching: Use data to provide targeted coaching for providers rather than broad, punitive training, turning KPIs into tools for improvement.
-
5Closing the loop builds trust: Visible process improvements, such as better check-in or clearer signage, strengthen patient trust and loyalty.
In today’s healthcare environment, patient experience is no longer a “soft” metric. It is a strategic priority. Health systems and clinics recognize that how patients feel about their care directly affects safety outcomes, treatment adherence, loyalty, online reputation, and reimbursement in value-based care models.
When patients feel heard, respected, and clearly informed, they are more likely to follow treatment plans, attend follow-ups, and recommend the provider to others. When communication is unclear or wait times feel excessive, frustration increases, trust declines, and operational strain intensifies.
Patient Experience Analytics addresses this challenge by transforming subjective feedback into structured, actionable insight. Instead of treating surveys, reviews, and complaints as isolated opinions, analytics organizes them into measurable trends that guide frontline behavior, staffing decisions, workflow improvements, and process redesign.
Rather than guessing why scores fluctuate, leaders can pinpoint root causes. Instead of reacting to isolated complaints, organizations can identify system-level patterns. Instead of broad, unfocused initiatives, they can deploy targeted improvements where they will have the greatest impact.
This guide explains what patient experience analytics is, which data sources matter most, and how it directly improves care delivery and operational performance.
Table of Contents
What Is Patient Experience Analytics?

From Anecdotes to Analyzable Signals
Patient Experience Analytics is the systematic collection and analysis of patient feedback, behavioral data, and interaction signals across the full care journey. This includes appointment scheduling, waiting room interactions, clinical visits, portal communications, billing touchpoints, and post-visit follow-ups.
Traditionally, patient feedback lived in spreadsheets and comment cards. Leaders might review a handful of survey responses and make limited adjustments. Today, healthcare organizations generate thousands of data points each week—from online reviews and SMS surveys to call logs and portal messages. Without structured analytics, this information becomes overwhelming.
Modern patient feedback analytics platforms centralize both structured data (ratings, numerical scores) and unstructured data (written comments, complaints, reviews). Using AI and Natural Language Processing (NLP), these systems can:
- Detect sentiment (positive, neutral, negative)
- Classify themes such as communication, wait time, billing confusion, or staff behavior
- Identify recurring patterns across departments and locations
Instead of anecdotal stories, clinics gain analyzable signals. Instead of scattered complaints, they see consistent trends. That transformation—from opinion to measurable insight—is the foundation of effective healthcare experience analytics.
Patient Experience vs Satisfaction vs Engagement
Although often used interchangeably, these concepts represent distinct dimensions of care.
Patient experience refers to what actually happens during care delivery. It includes how clearly information is explained, how long patients wait, how respectfully they are treated, and how smoothly processes function.
Patient satisfaction reflects whether expectations were met. It is commonly measured through patient satisfaction metrics such as star ratings, survey scores, and likelihood-to-recommend responses.
Patient engagement describes how actively patients participate in their care, including portal usage, medication adherence, and attendance at follow-up appointments.
Analytics should begin with experience. Experience shapes satisfaction. Satisfaction influences engagement. Engagement impacts clinical outcomes. By focusing first on patient experience metrics, organizations can improve downstream patient satisfaction KPIs in a more sustainable way.
Key Data Sources for Patient Experience Analytics

Effective healthcare experience analytics requires multiple data streams. Surveys alone provide only a partial view.
Traditional Experience Data
Structured data sources include:
- CAHPS-style surveys
- Post-visit SMS or email feedback
- In-clinic kiosks or tablets
- Net Promoter Score responses
These tools generate measurable patient satisfaction KPIs such as:
- Overall visit rating
- Communication clarity
- Likelihood to recommend
- Perceived wait time
Tracking patient satisfaction data trends over time allows leaders to monitor performance shifts and compare against patient experience benchmarks. However, numerical scores rarely explain why performance changes.
Voice of the Patient in the Wild
Beyond formal surveys lies unstructured feedback from public platforms and direct complaints, including:
- Google reviews
- Healthgrades
- Yelp
- Social media comments
- Patient forums
- Open-ended survey responses
- Complaint logs
Patient survey analytics and broader patient feedback analytics convert these comments into structured themes. For example:
- “Waited 45 minutes past my appointment.”
- “The nurse was kind but rushed.”
- “No one explained my lab results.”
Analyzing thousands of such comments manually is impractical. AI-powered sentiment detection extracts recurring issues and converts them into measurable patient experience quality indicators.
Operational and Clinical Signals
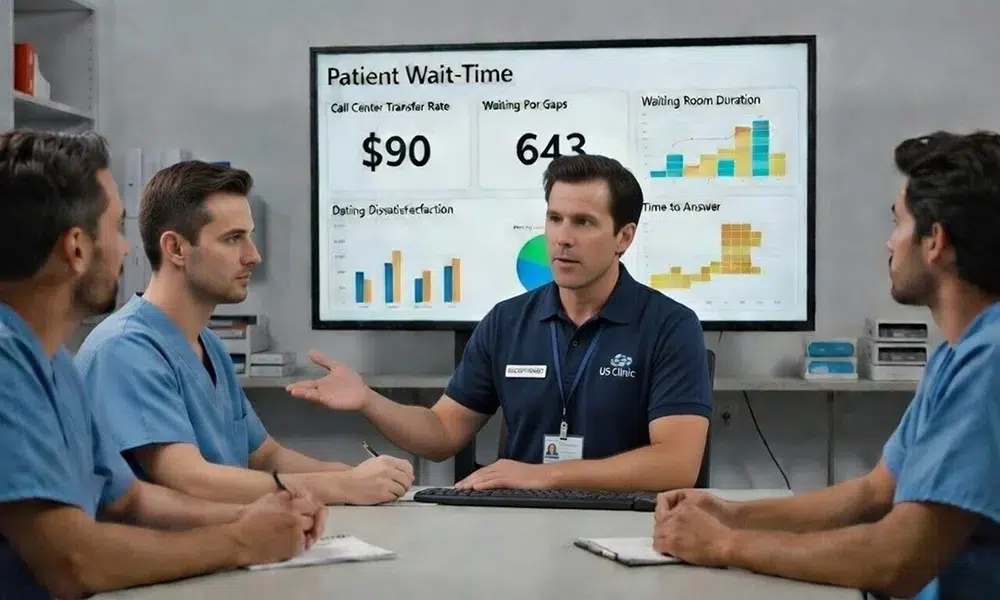
Perception data becomes significantly more powerful when integrated with operational metrics such as:
- Appointment access times
- Waiting room duration
- Call center abandonment rates
- Time to answer calls
- Transfer rates
- Portal message volume
- No-show rates
- Repeat visits due to confusion
Combining perception data with operational performance enables deeper patient experience data analysis. For instance, if wait-time complaints rise on specific days, operational data may reveal scheduling congestion or staffing gaps. Integrating these data streams allows patient journey analytics in healthcare to move beyond surface-level reporting.
How Analytics Transforms Raw Data into Insight
Descriptive Analytics – What’s Happening?
Descriptive analytics summarizes patient experience metrics over time. Dashboards may display:
- Monthly satisfaction score trends
- Department-level comparisons
- Provider-specific communication ratings
- Heat maps highlighting recurring issues
For example, a clinic may discover that communication scores consistently lag behind other service lines. At this stage, analytics answers the question: What is happening?
Diagnostic Analytics – Why Is It Happening?
Diagnostic analytics examines the root causes behind trends. Segmentation allows analysis by:
- Visit type
- Time of day
- Location
- Provider
- Demographics
Using NLP, analytics platforms can identify common complaint themes such as long waits, confusing discharge instructions, or scheduling difficulty.
If complaints cluster during high-volume hours, operational strain may be the cause. If dissatisfaction centers around a specific provider or workflow step, targeted intervention becomes possible. This stage connects patient experience KPIs with operational realities.
Predictive and Prescriptive Analytics
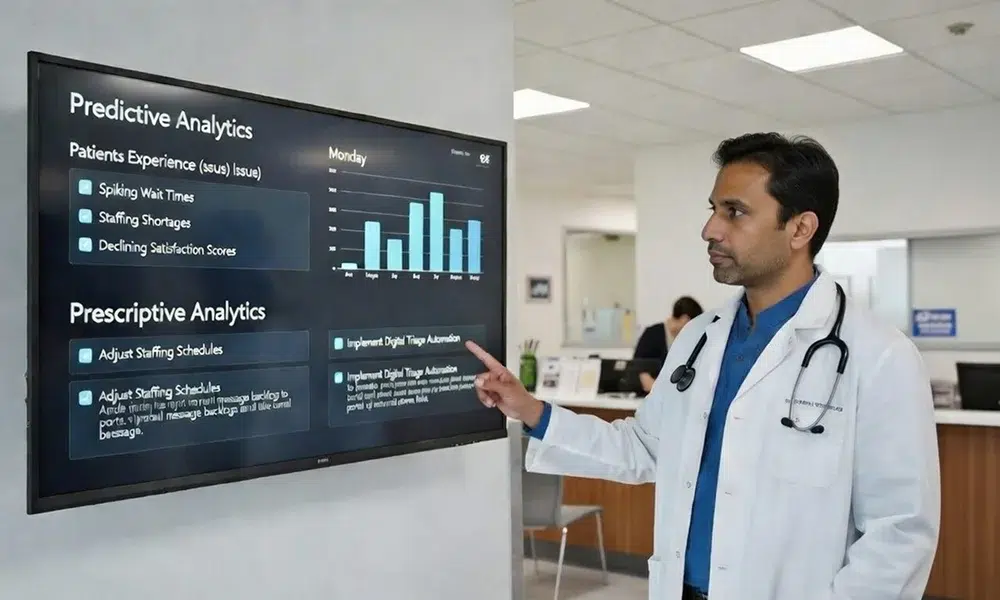
Predictive analytics identifies risk patterns before satisfaction declines. For example, if staffing levels drop while patient volume increases, historical data may show a predictable decline in communication scores.
Prescriptive analytics recommends actions:
- If wait-time complaints spike on Mondays, adjust staffing or appointment templates.
- If portal message backlogs grow, implement digital triage automation.
This approach transforms patient experience benchmarks from passive comparison tools into proactive improvement drivers.
Five Ways Patient Experience Analytics Improves Care Delivery
1. Shortening Waits and Smoothing Patient Flow
Long wait times are the most visible pain point in modern healthcare. Clinics typically see 15-25% of patient complaints mention waiting—whether for appointments, in the lobby, or in exam rooms.
Patient flow solutions can address these issues by streamlining scheduling, optimizing room assignments, and improving overall clinic efficiency, ultimately reducing wait times and enhancing the patient experience.
The Problem Patient Experience Data Reveals:
When you analyze patient feedback analytics for waiting complaints, patterns emerge that operational dashboards alone never show. A clinic might see:
- 47% of feedback mentions waiting in lobby (actual: 18 minutes average)
- 31% mention difficulty getting appointments (actual: 12.5-day wait for routine appointments)
- 22% describe feeling rushed during visits
These perception-based patient satisfaction metrics often diverge from reality. A patient waiting 18 minutes in a lobby may feel it was 30 minutes if they weren’t informed of the wait or given updates.
How Patient Journey Analytics in Healthcare Connects Perception to Operations:
Patient experience data analysis integrates complaint themes with operational metrics:
- Day/time segmentation: “Wait complaints spike on Tuesday mornings” + operational data shows “appointment slots overbooked by 15%” + scheduling system data reveals “two providers both booked for 30-minute slots at 9:00 AM”
- Root cause identified: Scheduling templates are identical across providers despite different efficiency levels
- Action: Adjust templates—Provider A gets 25-minute slots, Provider B keeps 30-minute slots
- Result tracked: Wait-time complaints drop 34% in 4 weeks; overall patient satisfaction scores increase 0.8 points
Implementing Patient Experience Improvement Through Wait Analytics:
Step 1: Segment complaints by visit type and time of day (1 week of data)
Step 2: Cross-reference with wait-time operational logs from scheduling system (match same week)
Step 3: Identify correlation patterns using patient feedback analytics dashboards
Step 4: Prioritize the highest-impact bottleneck (biggest complaint volume + easiest fix)
Step 5: Implement change and monitor patient experience KPIs weekly for 4 weeks Step 6: Measure: complaints, satisfaction scores, actual wait times, staff workload
Measurable Healthcare Experience Metrics:
- Baseline wait-time complaints: 8-12 per week → Target: 3-5 per week (60% reduction)
- Baseline average TTA (time to appointment): 12.5 days → Target: 10 days (20% improvement)
- Baseline patient satisfaction on “speed of service”: 6.8/10 → Target: 7.8/10
When patient experience benchmarks show waiting problems, clinics armed with integrated operational data can fix the actual root cause—not just respond to complaints.
2. Improving Communication and Discharge Instructions

Themes like “didn’t understand instructions” often correlate with non-adherence or readmissions. Patient s”Didn’t understand my instructions” and “Unclear about next steps” are among the highest-impact healthcare experience analytics findings because they directly predict poor outcomes.
What Patient Survey Analytics Reveals:
Natural Language Processing (NLP) analysis of open-ended feedback often clusters comments like:
- “No one explained what my lab results meant”
- “Didn’t know I was supposed to fast before the test”
- “Left confused about when to take my medication”
- “No information about warning signs to watch for”
Patients reporting unclear communication are significantly more likely to:
- Skip follow-up appointments (non-adherence)
- Call back with preventable questions (increases call volume)
- Miss medication doses (clinical safety issue)
- Leave negative online reviews (impacts reputation)
How Patient Experience Data Analysis Bridges Clinical and Operational Gaps:
Patient feedback analytics allows you to:
Segment by communication type: “Lab result explanation” vs. “Medication instructions” vs. “When to call back” vs. “Activity restrictions”
Identify severity patterns: Comments mentioning confusion about lab results appear in 18% of feedback from one provider but only 4% from another—signaling a specific communication gap
Track downstream impact: Patient experience benchmarks show that clinics with “clear communication” ratings above 7.5/10 have:
- 25% higher follow-up appointment adherence
- 40% fewer “clarification calls” to the clinic
- 60% fewer readmissions for chronic disease patients
Implementing Measurable Communication Improvement:
Week 1-2: Collect baseline patient satisfaction metrics and patient experience KPIs
- Current communication clarity rating: 6.9/10
- “Didn’t understand” complaints: 22 per month
- Follow-up visit no-show rate: 18%
Week 3-4: Redesign based on patient feedback analytics
- Update after-visit summaries (make them visual, simpler language)
- Implement teach-back protocol (patient explains what they heard)
- Send automated follow-up text with next steps reminder
Week 5-8: Monitor patient experience metrics
- Track patient satisfaction score trajectory
- Review patient survey analytics for communication theme mentions
- Monitor follow-up no-show rates
Measurable healthcare experience improvements:
- Communication clarity: 6.9/10 → 8.1/10 (by week 8)
- “Confusion” complaints: 22/month → 5/month
- Follow-up adherence: 82% → 91%
- Patient feedback analytics show shift from problem mentions to positive comments
The insight: Patient experience analytics doesn’t just measure satisfaction—it connects perception directly to clinical safety and operational efficiency.
3. Targeting Staff Training and Coaching
Traditional quality improvement approaches often mandate system-wide training when patient experience data shows problems. This wastes time and demotivates staff who aren’t actually struggling.
What Patient Experience Data Analysis Reveals:
Instead of “communication scores are low,” patient feedback analytics allows granular discovery:
- Provider A: patient satisfaction score 8.2/10 on communication
- Provider B: patient satisfaction score 6.9/10 on communication
- Provider C: patient satisfaction score 7.4/10 on communication
Patient survey analytics examining Provider B’s feedback specifically shows:
- “Didn’t make eye contact” (mentioned 7 times in 60 patient comments)
- “Seemed rushed” (mentioned 12 times)
- “Didn’t answer my questions” (mentioned 5 times)
- “Very professional” (mentioned 18 times—professional demeanor is not the issue)
The Insight: Provider B has excellent technical knowledge but struggles with patient engagement and pacing.
Patient experience benchmarking data for Provider B’s colleague (A) shows different patterns:
- “Explained things clearly” (mentioned 24 times)
- “Took time to listen” (mentioned 18 times)
- “Made me feel heard” (mentioned 22 times)
Implementing Precision Coaching Using Patient Experience KPIs:
Step 1: Use patient feedback analytics to identify the specific gap (Provider B: engagement/pacing, not knowledge)
Step 2: Design targeted coaching (not system-wide training)
- 3 coaching sessions focused on: eye contact, pacing check-ins, listening techniques
- Peer observation with Provider A (2 hours)
- Role-play for difficult scenarios (handling emotional patients, managing time pressure)
Step 3: Monitor progress using patient experience metrics
- Track Provider B’s communication satisfaction score weekly (not quarterly)
- Review next 20-30 patient comments specifically for engagement themes
Step 4: Celebrate improvement
- After 6 weeks: Provider B’s communication score improves from 6.9 to 7.6
- Patient comments shift: more mentions of “listened,” fewer of “rushed”
- Clinic-wide patient satisfaction metrics improve 0.3 points from this one provider’s improvement
Key patient experience analytics insight: This targeted approach avoids:
- Demoralizing Provider A with unnecessary training (they’re already excellent)
- Wasting time on broad communication workshops
- Making Provider B feel singled out punitively
Patient experience data analysis enables development rather than discipline.
4. Aligning Staffing with Demand
Patient experience analytics reveals demand patterns that operational scheduling systems alone never show clearly.
What Patient Feedback Analytics Reveals:
Patients don’t complain about understaffing—they complain about symptoms of it:
- “Felt like the nurse was in a rush”
- “No one had time to answer my questions”
- “It was very chaotic”
- “Long wait between exam room and provider”
When you correlate these patient satisfaction metrics with time-of-day and day-of-week operational data, patterns emerge:
Patient experience benchmarking shows:
- Afternoon clinics: 31% of feedback mentions feeling rushed
- Morning clinics: 12% of feedback mentions feeling rushed
- Tuesday-Thursday: higher rushed mentions than Monday/Friday
Operational data reveals:
- Afternoon slots overbooked by 18-22% vs. morning (16% vs. 12%)
- Fewer front-desk and nursing staff scheduled afternoon (2 FTE vs. 3 FTE morning)
- Provider schedule doesn’t account for complexity (shorter appointments scheduled when volume is highest)
Implementing Patient Flow Optimization Using Patient Experience Data:
Patient journey analytics in healthcare allows dynamic adjustments:
Current state:
- 8:00-12:00 AM: 3 staff (front desk), 4 nurses, 2 providers
- 1:00-5:00 PM: 2 staff (front desk), 3 nurses, 2 providers
- Patient satisfaction on “pacing” morning: 7.6/10
- Patient satisfaction on “pacing” afternoon: 6.2/10
Data-driven adjustment:
- Increase afternoon front-desk staff to 3 FTE (handles check-in pressure)
- Add 1 additional afternoon nurse (reduces “wait for provider” complaints)
- Schedule complex cases 8:00-11:00 AM (peak provider energy)
- Reserve 1:00-2:00 PM for simpler, quicker appointments
Result tracked (4 weeks):
- Afternoon patient satisfaction: 6.2 → 7.1 (0.9-point improvement)
- “Rushed” complaints: 31% → 18%
- Overall afternoon wait times: 16.3 min → 12.5 min
- Staff workload perception: improved during peak period
- Staff overtime: slightly increased afternoon (offset by reduced stress/burnout)
Patient experience KPIs show: Healthcare experience analytics proves that staffing decisions based on patient feedback create better outcomes than decisions based on budget spreadsheets alone.
5. Closing the Loop and Building Trust
The most underutilized opportunity in patient experience analytics: showing patients their feedback led to action.
What Patient Feedback Analytics Often Misses:
Clinics implement improvements—better signage, faster check-in, clearer discharge summaries—but patients don’t notice or don’t connect the change to their earlier feedback. Trust doesn’t strengthen because the feedback loop remains invisible.
How Patient Experience Data Analysis Enables Loop Closure:
Step 1: Identify the top 3 feedback themes from patient survey analytics
- “Long wait for appointment” (31% of feedback)
- “Wait time in office too long” (26% of feedback)
- “Unclear discharge instructions” (18% of feedback)
Step 2: Implement targeted improvements (see sections 1-4 above)
Step 3: Track patient experience KPIs before/after (demonstrate results through data)
- Appointment wait time: 12.5 days → 10.2 days
- Office wait time: 18.5 min → 13.2 min
- “Unclear instructions” complaints: 12/month → 3/month
Step 4: Close the loop with patients and staff
- Share results with patients at visit: “In your feedback, you told us waits were too long. We’ve redesigned our schedule, and average wait time is now [X] minutes.”
- Communicate with staff: “Patient feedback showed [theme]. Here’s what we changed, here’s the improvement.”
- Publish results: email newsletter, waiting room signage, website
Patient Experience Benchmarking Impact:
Clinics that visibly close feedback loops see:
- Patient satisfaction scores improve 1.2-1.8 points (beyond the improvement from the fix itself)
- Online review ratings improve 0.3-0.5 stars
- Patient loyalty/retention increases 8-12%
- Staff engagement increases (they see their work matters)
The Data-Driven Insight:
Patient experience metrics are not just management tools—they are communication tools. When patients see their feedback genuinely influenced change, trust strengthens in ways that patient satisfaction surveys don’t fully capture.
The virtuous cycle: Better patient experience → Higher satisfaction scores → Visible improvement → Demonstrated listening → Increased trust → Loyalty.
Turning Insights into Action: A Simple PX Analytics Workflow
Step 1 – Define Clear Questions
Identify priority concerns:
- Where are we losing patient trust?
- Which stage of the visit creates the most friction?
Clear questions guide focused analysis.
Step 2 – Collect and Centralize Data
Combine surveys, online reviews, call center metrics, and operational logs into a unified system for comprehensive patient experience data analysis.
Step 3 – Analyze Themes and Trends
Use dashboards and sentiment analysis to detect hotspots, compare patient experience benchmarks, and monitor patient satisfaction KPIs over time.
Step 4 – Prioritize Improvements

Translate insight into measurable goals, such as reducing check-in time by 30 percent within three months.
Step 5 – Monitor Impact and Iterate
Track before-and-after results. Evaluate whether changes improved both patient experience metrics and operational performance. Continuous monitoring turns analytics into a sustainable improvement cycle.
Common Pitfalls in Patient Experience Analytics
- Focusing only on numerical scores while ignoring qualitative comments
- Using analytics in a punitive manner rather than a learning-oriented approach
- Failing to integrate operational data with perception data
- Chasing benchmarks without contextual understanding
- Overloading teams with excessive metrics
- Neglecting privacy and HIPAA compliance
Avoiding these pitfalls ensures analytics drives meaningful improvement rather than superficial score management.
Practical Tips for Getting Started

- Begin with one clinic or service line before scaling
- Combine two to three data sources initially
- Involve frontline staff in reviewing findings
- Share insights transparently in team meetings
- Set measurable goals tied to patient experience KPIs
- Review patient satisfaction data trends monthly
- Celebrate progress to reinforce improvement
Small, focused initiatives often create momentum for broader adoption.
How AI-Powered Patient Experience Analytics Accelerates Improvement
AI enhances patient feedback analytics by analyzing thousands of comments in minutes. It can:
- Detect emerging sentiment shifts
- Identify sudden spikes in complaint themes
- Correlate PX patterns with operational data
- Generate automated alerts for emerging risks
For example, if mentions of long waits increase alongside rising call volumes, the system can flag potential congestion before overall satisfaction scores decline.
AI-powered healthcare experience analytics enables real-time responsiveness instead of quarterly retrospectives. It transforms reactive surveys into continuous patient experience intelligence that directly informs staffing, scheduling, and communication strategies.
Conclusion:
Patient experience is not just a score. It is the lived reality of every interaction, every phone call answered, every instruction explained, every minute spent waiting, and every moment of reassurance.
Patient Experience Analytics gives healthcare leaders the ability to see those moments clearly and at scale. It transforms scattered feedback into meaningful patterns. It connects patient perception with operational performance. And most importantly, it turns insight into action.
When clinics move beyond surface-level patient satisfaction score analysis and embrace deeper patient experience data analysis, improvement becomes intentional instead of reactive. Bottlenecks are identified early. Communication gaps are corrected. Staffing aligns with demand. Trust grows because patients see real change.
FAQs
What’s the difference between patient experience and patient satisfaction data?
Patient experience data reflects what actually happened during care (wait times, communication, processes). Patient satisfaction data measures whether those experiences met patient expectations.
Do small clinics really have enough data to do analytics?
Yes. Even small clinics generate surveys, reviews, call logs, and scheduling data. Combining just two or three sources is enough to uncover meaningful trends.
How does patient experience analytics differ from traditional quality improvement?
Traditional quality improvement focuses on clinical outcomes and process metrics. Patient experience analytics focuses on how patients perceive those processes, and connects perception to operational performance.
Can we use social media and online reviews safely under HIPAA?
Yes, if handled properly. Analyze publicly available feedback in aggregate, avoid engaging with protected health information, and ensure all data management follows HIPAA compliance guidelines.

