
Key Takeaways
-
1New patient wait times rise: The average wait time for new-patient appointments is now 31 days, a significant increase over recent years.
-
2Patient dissatisfaction starts at 20 minutes: Satisfaction declines sharply when wait times exceed 19–22 minutes, making this a crucial benchmark.
-
3First-time patients are sensitive to delays: First-time patients wait longer and are more affected by delays, making a poor first impression costly.
-
4Automated waitlists reduce delays: Smart scheduling tools, like automated waitlists, can advance appointments by weeks, improving access without adding providers.
-
5Improvement is possible: 77% of practice leaders reported improved or consistent wait times, thanks to better staffing, schedule redesign, and updated systems.
Patient wait times are no longer just a minor inconvenience. They directly affect access to care, patient satisfaction, provider reputation, operational efficiency, and clinic revenue.
When patients wait weeks for an appointment, or sit in a waiting room longer than expected, it shapes how they perceive your quality of care before the provider even enters the room.
In a review-driven healthcare environment, time has become one of the most visible indicators of performance.
Across the United States, both appointment wait times and in-clinic delays are being measured more closely than ever before. Healthcare systems track patient wait time metrics to improve access.
Payers evaluate patient wait time measures as part of quality reporting. Practice administrators compare their numbers against regional patient wait time benchmarks to stay competitive.
At the same time, patient expectations are changing. Consumers are used to on-demand services in banking, retail, and transportation. When healthcare feels slower than other industries, dissatisfaction rises quickly.
Understanding patient wait time statistics is no longer optional for clinic leaders. It is essential for improving access, protecting reputation, and strengthening financial performance.
In this blog, we’ll walk through 10 key patient wait time statistics every clinic leader should know, and explain what each one means for your practice.
Table of Contents
Top 10 Patient Wait Time Statistics
Below is a data-driven overview of how long patients wait for care, how those waits are changing, and why they matter for clinic performance.
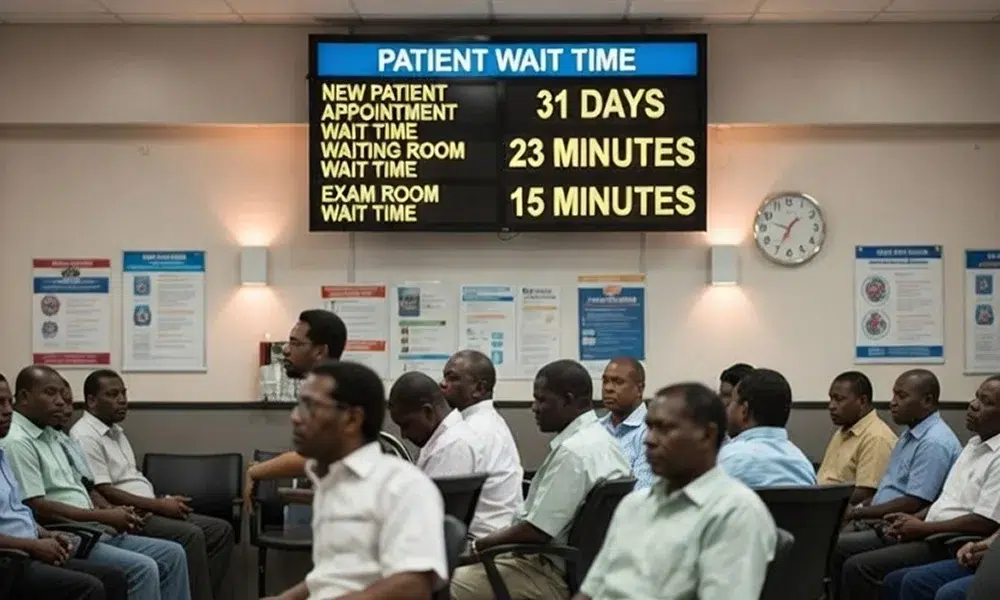
Stat 1 – New Patient Appointment Wait Times Have Reached About a Month
Across six major specialties in 15 large U.S. metropolitan areas, the average wait time for a new-patient appointment is 31 days. That represents a 19% increase since 2022 and a 48% increase since 2004.
Specialty breakdowns show variation:
- Family medicine: approximately 23.5 days
- Cardiology: approximately 32–33 days
- Dermatology: approximately 36.5 days
- OB/GYN: approximately 41–42 days
These healthcare patient wait time statistics reveal a growing access challenge. It is increasingly difficult for new patients to enter the system.
From an operational standpoint, a 31-day delay creates multiple risks:
- Patients seek care elsewhere
- Conditions worsen while waiting
- Referral networks weaken
- Revenue growth slows
In competitive urban markets, patients often call multiple clinics. The first office that offers a reasonable timeframe frequently wins. This makes average patient wait time statistics a growth indicator, not just an operational one.
Long new-patient delays also create equity concerns. Communities with limited provider supply often experience even longer waits, amplifying disparities in care access.
For clinic leaders, this statistic establishes the baseline problem: delayed access is now common.
Stat 2 – Patients Wait Around 20–30 Minutes in the Waiting Room
In ambulatory care settings, research shows patients wait about 23 minutes in the waiting room and about 15 minutes in the exam room.
Other clinic patient wait time statistics commonly report 20–30 minutes as the typical lobby wait in U.S. primary care settings.
While these numbers may appear modest compared to month-long appointment delays, they significantly influence patient perception.
Patients rarely distinguish between:
- Administrative delay
- Clinical delay
- Provider delay
They simply experience waiting.
It is important to distinguish between two patient wait time indicators:
- Door-to-room time (check-in to exam room)
- Room-to-provider time (exam room to clinician arrival)
Many practices track one but not both. However, total perceived waiting time is what shapes satisfaction.
Outpatient patient wait time statistics show that even when clinical quality is strong, long in-office waits can erode trust and confidence.
This is where operational inefficiencies—late arrivals, overbooking, poor schedule templates, extended appointment durations—translate directly into patient dissatisfaction.
Stat 3 – Longer Waits Directly Lower Patient Satisfaction Scores

A consistent finding across patient waiting time statistics is that longer waits are associated with lower satisfaction.
Large ambulatory studies show that as wait time increases, ratings decline across nearly every experience dimension, including:
- Perceived quality of care
- Confidence in the provider
- Likelihood to recommend
- Overall visit rating
This relationship holds even when clinical outcomes are positive.
Why does this happen?
Because patients evaluate the entire experience, not just the medical interaction. Time feels personal. It communicates respect—or lack of it.
Online reviews often mention wait times specifically. A provider may deliver excellent care, but a one-hour delay can dominate the review narrative.
From a business perspective, declining satisfaction scores can affect:
- Reputation
- Referral patterns
- Patient retention
- Value-based reimbursement models
Healthcare patient wait time statistics clearly connect time management with financial performance.
Stat 4 – Patients Start Getting Unhappy After About 20 Minutes
Research suggests that patients expect to wait around 20 minutes. Satisfaction declines significantly when waits exceed approximately 19–22 minutes.
This creates a psychological threshold.
Under 20 minutes, most patients remain neutral or tolerant.
Beyond 20 minutes, frustration increases rapidly.
This threshold provides a practical operational benchmark. Clinics can set measurable targets aligned with patient expectations.
For example:
- Total in-office waiting time under 20 minutes
- Lobby wait under 15 minutes
- Exam room wait under 10 minutes
These become actionable patient wait time measures rather than abstract goals.
When clinics align performance targets with patient psychology, satisfaction improves without necessarily reducing appointment volume.
Stat 5 – First-Visit Patients Are Even More Sensitive to Wait Times
First-visit patients wait longer on average (about 23.1 minutes) than repeat patients (about 19.6 minutes). They are also more sensitive to delay.
This is critical for growth-focused practices.
New patients are forming first impressions. If their initial experience includes long waits, confusion, or scheduling friction, they are less likely to return.
Losing a new patient does not mean losing one visit. It means losing:
- Future visits
- Preventive care opportunities
- Referrals
- Lifetime revenue
From a patient wait time trends in healthcare perspective, this shows how operational inefficiencies can quietly reduce long-term growth.
Improving new-patient flow often produces disproportionately large returns.
Stat 6 – Wait Times Are Rising Across Many Specialties

Recent data shows continued increases:
- Overall new-patient wait times up 19% since 2022
- OB/GYN up 33%
- Cardiology up 23%
- Family medicine up 14%
- Dermatology up 6%
These patient wait time trends in healthcare reflect broader systemic pressures:
- Aging population
- Chronic disease prevalence
- Workforce shortages
- Provider burnout
- Administrative burden
Technology alone has not solved access challenges.
Without intentional capacity management and scheduling optimization, delays will likely continue rising.
This makes patient wait time metrics essential for strategic planning.
Stat 7 – Even Established Patients Wait Weeks for Appointments
Patients with an established primary care provider still face an average of around 20.6 days to see a family medicine physician.
This shows access issues extend beyond new patients.
Delayed follow-ups impact:
- Chronic disease monitoring
- Medication management
- Preventive screenings
- Post-hospital discharge care
When access tightens, patients often shift to urgent care or emergency departments, increasing system costs.
Outpatient patient wait time statistics demonstrate that improving follow-up access may reduce downstream healthcare utilization.
For clinics, improving established-patient scheduling can protect continuity and reduce leakage.
Stat 8 – U.S. Wait Challenges Aren’t Unique Globally
Global comparisons show U.S. emergency room waits average around 24 minutes, while several countries report waits exceeding one to two hours.
However, international comparisons can obscure local expectations.
Patient wait time benchmarks should be based on:
- Regional averages
- Market competition
- Patient demographics
- Service mix
Patients compare your clinic to alternatives in their community—not global averages.
Even if U.S. waits are shorter than some countries, exceeding local expectations still damages satisfaction.
Stat 9 – Automated Waitlists Can Shorten Access Delays
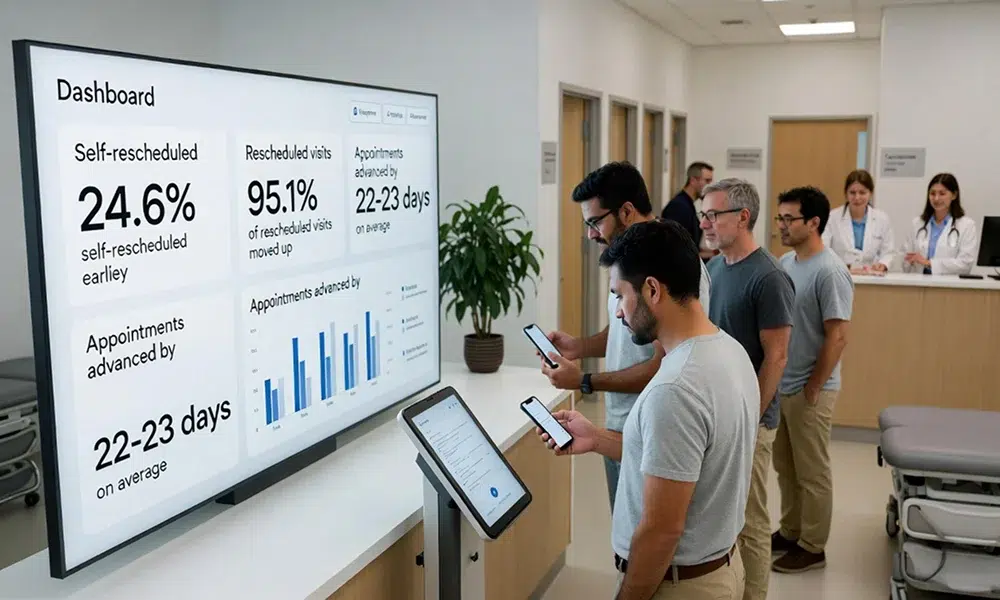
In a Mayo Clinic study of an automated waitlist and self-rescheduling system:
- 24.6% of waitlisted appointments were self-rescheduled earlier
- 95.1% of rescheduled visits were moved up
- Appointments were advanced by 22–23 days on average
- Median improvement was approximately 15 days
This demonstrates that automation can significantly reduce delays without adding providers.
Traditional manual waitlists rely on staff callbacks, which are time-consuming and inconsistent.
Automated systems:
- Identify cancellations instantly
- Offer slots digitally
- Allow immediate confirmation
- Reduce unused capacity
This is one of the most actionable healthcare patient wait time statistics available.
It shows clinics can reduce average patient wait time statistics by weeks with smarter scheduling.
Stat 10 – Targeted Strategies Can Improve Wait Times
An MGMA snapshot found 77% of practice leaders reported wait times either improved or stayed the same in 2024.
Improvements were linked to:
- Better staffing alignment
- Schedule template redesign
- Extended hours
- Updated scheduling systems
This confirms that wait times are not fixed constraints. They respond to operational strategy.
Clinics that monitor patient wait time indicators and act on them see measurable improvements.
What These 10 Statistics Mean for Your Clinic
When viewed together, these patient wait time statistics tell a clear story.
- Access is delayed.
- Patients often wait weeks to secure appointments.
- In-clinic waits exceed expectations.
- Many visits surpass the 20-minute tolerance threshold.
- Satisfaction declines as waits grow.
- Even excellent care cannot fully offset frustration caused by delay.
- Improvement is possible.
- Automation and smarter scheduling can reduce delays significantly.
- Time is both a quality metric and a growth metric.
How AI and Automation Can Help Reduce Wait Times

The statistics are clear: new-patient appointments take 31 days to secure. In-clinic waits exceed patient tolerance thresholds. Satisfaction declines predictably with every minute added to the waiting experience.
But here’s what’s equally clear: clinics that implement targeted AI and automation solutions see measurable improvements. This is not theoretical—it’s backed by operational data.
Modern clinics are moving beyond manual processes that create delays. They’re deploying AI and automation at five critical touchpoints to systematically reduce both appointment wait times and in-clinic delays.
Here’s exactly how each solution moves the needle:
AI Receptionists
The first delay patients experience is often before they even schedule.
Long phone hold times and missed calls represent lost revenue and patient frustration. A caller who waits 8 minutes and hangs up never makes an appointment. They become someone else’s patient.
An AI medical receptionist can help eliminate this problem by reducing hold times, ensuring that patients can book appointments without delays, and improving overall patient experience.
How AI receptionists reduce wait times:
- Answer calls instantly—no hold queue
- Understand clinical context and patient needs
- Check real-time availability and schedule intelligently
- Confirm appointments immediately without handoff
- Handle multilingual interactions automatically
- Capture after-hours inquiries with callback scheduling
Impact on patient wait times:
- Reduces phone hold times from average 8–12 minutes to under 2 minutes
- Cuts abandoned call rates by 40–50%
- Accelerates appointment booking by 25–35%
- Opens availability after business hours (increasing access perception)
- Recaptures 10–15% of callers who previously hung up
This directly addresses the 31-day new-patient appointment delay. When booking is instant and frictionless, clinics can fill appointments faster and reduce the perception of access problems.
Digital Pre-Registration and Check-In
Once patients arrive, paperwork becomes a hidden wait time multiplier.
Traditional check-in requires 10–15 minutes of form completion, insurance verification, and data entry. This extends total in-clinic wait time and delays door-to-room placement.
How digital pre-registration eliminates this delay:
- Collect intake forms 48 hours before appointment via secure SMS or email
- Verify insurance in real-time before patient arrives
- Flag insurance issues early—preventing post-visit payment delays
- Capture vital signs digitally with patient’s phone before arrival
- Auto-populate EHR with verified data
- Send appointment-specific instructions (lab work needed? Fasting? Bring ID?)
Impact on patient wait times:
- Eliminates 80% of lobby wait time caused by paperwork
- Reduces door-to-room time from 12–15 minutes to 3–5 minutes
- Improves data accuracy by 65%
- Reduces insurance-related claim denials post-visit
This directly improves the in-clinic experience. Patients move from check-in to clinical care faster, reducing total visit friction—the area where satisfaction declines most sharply after 20 minutes.
Automated Waitlists
When a patient cancels, the appointment slot sits empty. Waitlisted patients remain on hold for weeks. The practice loses revenue. Access numbers worsen.
Manual waitlist management creates delays because staff must:
- Notice a cancellation
- Find matching patients
- Place callback calls or send emails
- Wait for confirmation
- Update the schedule
By then, the momentum is lost.
How automated waitlists reclaim lost access:
- Detect cancellations instantly
- Automatically match waitlisted patients to open slots
- Send appointment offers via SMS (one-click confirmation)
- Move patients forward without phone tag
- Apply priority logic (soonest-waiting patients first)
- Track cancellation patterns to predict future openings
Impact on patient wait times:
- Fill 60–70% of cancellations within 24 hours
- Move waitlisted patients forward by 15–23 days on average (per Mayo Clinic data)
- Improve overall appointment utilization by 8–12%
- Recover $50,000–$100,000+ in annual appointment revenue
This directly reduces the 31-day new-patient wait and the 20-day established-patient wait. Automation fills gaps that staff cannot monitor manually.
Smart Scheduling Algorithms
Manual scheduling creates invisible bottlenecks.
Appointments get booked without regard to complexity. A 15-minute appointment is scheduled for a patient needing 30 minutes. Providers run late. Cascading delays ripple through the day. All waiting patients experience the impact.
AI patient scheduling can help optimize appointment durations by factoring in patient needs, reducing delays, and improving overall clinic efficiency.
How intelligent scheduling prevents delays:
- Predict appointment complexity and true duration needed
- Right-size appointment slots based on chief complaint and patient history
- Balance provider load to prevent overbooked days
- Identify high-risk no-show patients and proactively reschedule
- Optimize buffer time between appointments
- Smooth demand across the week (fill empty Thursday slots)
Impact on patient wait times:
- Reduces overbooking incidents by 15–20%
- Improves on-time start rates by 10–15%
- Reduces provider stress and late-visit cascades
- Opens 8–10 additional slots per week (same provider capacity)
Example: A clinic discovers routine physicals are booked for 30 minutes but complete in 18 minutes. Right-sizing these appointments alone creates weekly access gains without hiring.
Real-Time Patient Wait Time Dashboards
The final critical tool is visibility.
Most clinics review wait time metrics quarterly—in reports that arrive too late to act on. By then, patients have already left bad reviews and switched providers.
How real-time dashboards enable rapid improvement:
- Track current wait times live (not quarterly)
- Alert staff when waits exceed thresholds
- Show daily trends (identify recurring problems)
- Display provider-level data (which schedules cause bottlenecks?)
- Analyze patient cohorts (which demographics wait longest?)
- Forecast delays before they happen
Impact on patient wait times:
- Identifies bottlenecks in hours, not months
- Enables same-day staffing adjustments
- Turns wait time management from reactive to proactive
- Creates transparency that staff and patients notice
Real example: A clinic discovers Tuesday mornings consistently hit 35-minute waits. The dashboard reveals three high-complexity providers are scheduled simultaneously. By staggering complex cases, lobby wait drops to 12 minutes. Problem solved in one week instead of waiting for the quarterly review.
Conclusion
Patient wait time statistics reflect how accessible and patient-centered a clinic truly is.
They influence:
- Access to care
- Patient satisfaction
- Online reputation
- Revenue growth
- Long-term loyalty
In today’s healthcare environment, time is one of the clearest signals of value.
Clinics that actively manage and improve patient wait time indicators do more than reduce delays, they strengthen trust, improve retention, and position themselves for sustainable growth.
And in healthcare, trust is the foundation of everything.
FAQs
What are patient wait time statistics?
Patient wait time statistics measure how long patients wait for appointments and how long they wait during in-clinic visits.
What is the average patient wait time in clinics?
Average patient wait time statistics show about 20–30 minutes in the waiting room and around 31 days for new-patient appointments in many U.S. markets.
How do long wait times affect patient satisfaction?
Healthcare patient wait time statistics consistently show that satisfaction declines as wait times increase, especially after 20 minutes.
What patient wait time metrics should clinics track?
Clinics should track days to next appointment, lobby wait time, exam room wait time, and total visit cycle time.
Can clinics realistically reduce patient wait times?
Yes. Patient wait time trends in healthcare show that better scheduling systems, staffing alignment, and automation can significantly reduce delays.


